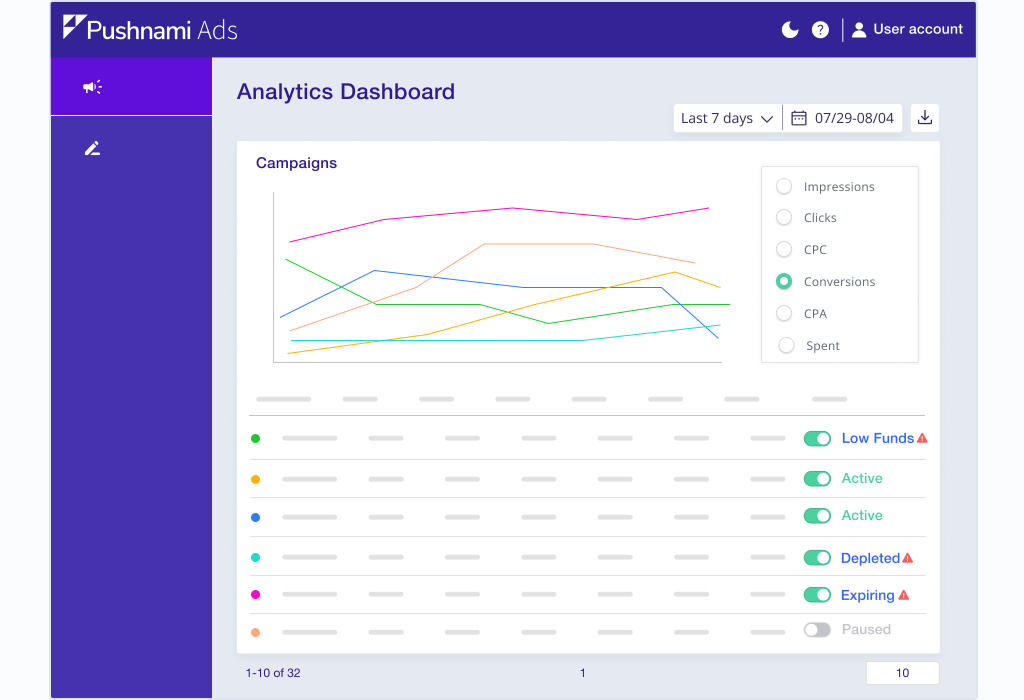
Analytics Dashboard
The Analytics Dashboard provides a comprehensive view of your advertising performance across all campaigns. Monitor key metrics, track trends, and make data-driven decisions to optimize your campaigns.
Accessing the Dashboard
Navigate to Analytics from the main menu to view your account-wide performance metrics.
Key Metrics
The dashboard displays six primary performance indicators:
Impressions
The total number of times your ads were displayed to users. Each time a push notification is shown, it counts as one impression.
- Use for: Measuring reach and visibility
- Trend indicator: Shows change from previous period
Clicks
The number of times users clicked on your notifications.
- Use for: Measuring engagement
- Higher is better: More clicks means your creatives are resonating
CTR (Click-Through Rate)
The percentage of impressions that resulted in clicks.
Formula: (Clicks ÷ Impressions) × 100
- Industry average: 1-3% for push notifications
- Use for: Evaluating creative effectiveness
CPC (Cost Per Click)
The average amount you paid for each click.
Formula: Total Spend ÷ Clicks
- Use for: Budget efficiency analysis
- Lower is better: Optimize bids and sources to reduce CPC
Conversions
The number of tracked conversion events from your campaigns.
- Requires: Conversion tracking setup
- Use for: Measuring actual business results
CPA (Cost Per Action)
The average cost to acquire one conversion.
Formula: Total Spend ÷ Conversions
- Use for: ROI analysis
- Target: Should be lower than your profit per conversion
Total Spent
The total amount spent across all campaigns in the selected time period.
- Use for: Budget tracking
- Compare to: Conversions and revenue to calculate ROI
eCPM (Effective Cost Per Mille)
The effective cost per 1,000 impressions.
Formula: (Total Spend ÷ Impressions) × 1000
- Use for: Comparing efficiency across campaigns
Time Period Filters
Analyze performance across different time periods:
| Filter | Description |
|---|---|
| Today | Current day's performance |
| Yesterday | Previous day's complete data |
| Last 7 Days | Weekly performance view |
| Last 30 Days | Monthly performance view |
| Month to Date | Current month through today |
| Custom Range | Select specific date range |
Dashboard Views
Summary Cards
At the top of the dashboard, summary cards show:
- Current period totals for each metric
- Change indicators (↑ or ↓) comparing to previous period
- Percentage change from previous period
Trend Charts
Time-series charts visualize performance over your selected period:
- Track daily or hourly fluctuations
- Identify patterns and anomalies
- Spot trends early
Campaign Breakdown
View metrics broken down by:
- By Campaign - Compare performance across campaigns
- By Creative - See which creatives perform best
- By Publisher - Identify top-performing traffic sources
Using Analytics for Optimization
Identify Top Performers
- Filter by Last 7 Days for reliable data
- Sort campaigns by Conversions or CPA
- Note which campaigns have the best metrics
- Allocate more budget to winners
Spot Underperformers
Look for campaigns with:
- High impressions but low clicks (creative issue)
- High clicks but low conversions (targeting or landing page issue)
- High CPA (bid or source optimization needed)
Track Trends
Monitor daily trends to catch:
- Sudden drops in performance (investigate immediately)
- Gradual improvement (keep current strategy)
- Day-of-week patterns (adjust schedules)
Campaign-Level Analytics
For detailed metrics on a specific campaign:
- Go to Campaigns from the main menu
- Click on the campaign name
- View the Spend tab for detailed analytics
Campaign-level analytics include:
- All standard metrics
- Publisher/source breakdown
- Creative performance comparison
- Historical trend data
Exporting Data
For detailed analysis or reporting:
- Use the Spend Report API for programmatic access
- Export CSV files from the Billing section for payment data
- Contact support for custom reporting needs
Best Practices
Daily Monitoring
Check the dashboard daily to:
- Verify campaigns are running
- Catch anomalies early
- Track against daily goals
Weekly Analysis
Each week, review:
- Overall CPA trends
- Top and bottom performing campaigns
- Source optimization opportunities
Monthly Review
Monthly, analyze:
- Budget utilization
- ROI by campaign and vertical
- Seasonal patterns
Understanding Metric Changes
Sudden Performance Changes
If metrics change dramatically:
- Check for creative rejections
- Verify billing status
- Review recent campaign changes
- Check for source blocks or changes
Gradual Performance Decline
If performance slowly decreases:
- Creative fatigue - refresh your creatives
- Audience saturation - adjust targeting
- Competitive pressure - review bids
Next Steps
- Set up conversion tracking if not already configured
- Enable Source Optimization to improve CPA
- Review Best Practices for creative optimization